This example was created from a .qmd file using Quarto.
Meet the penguins
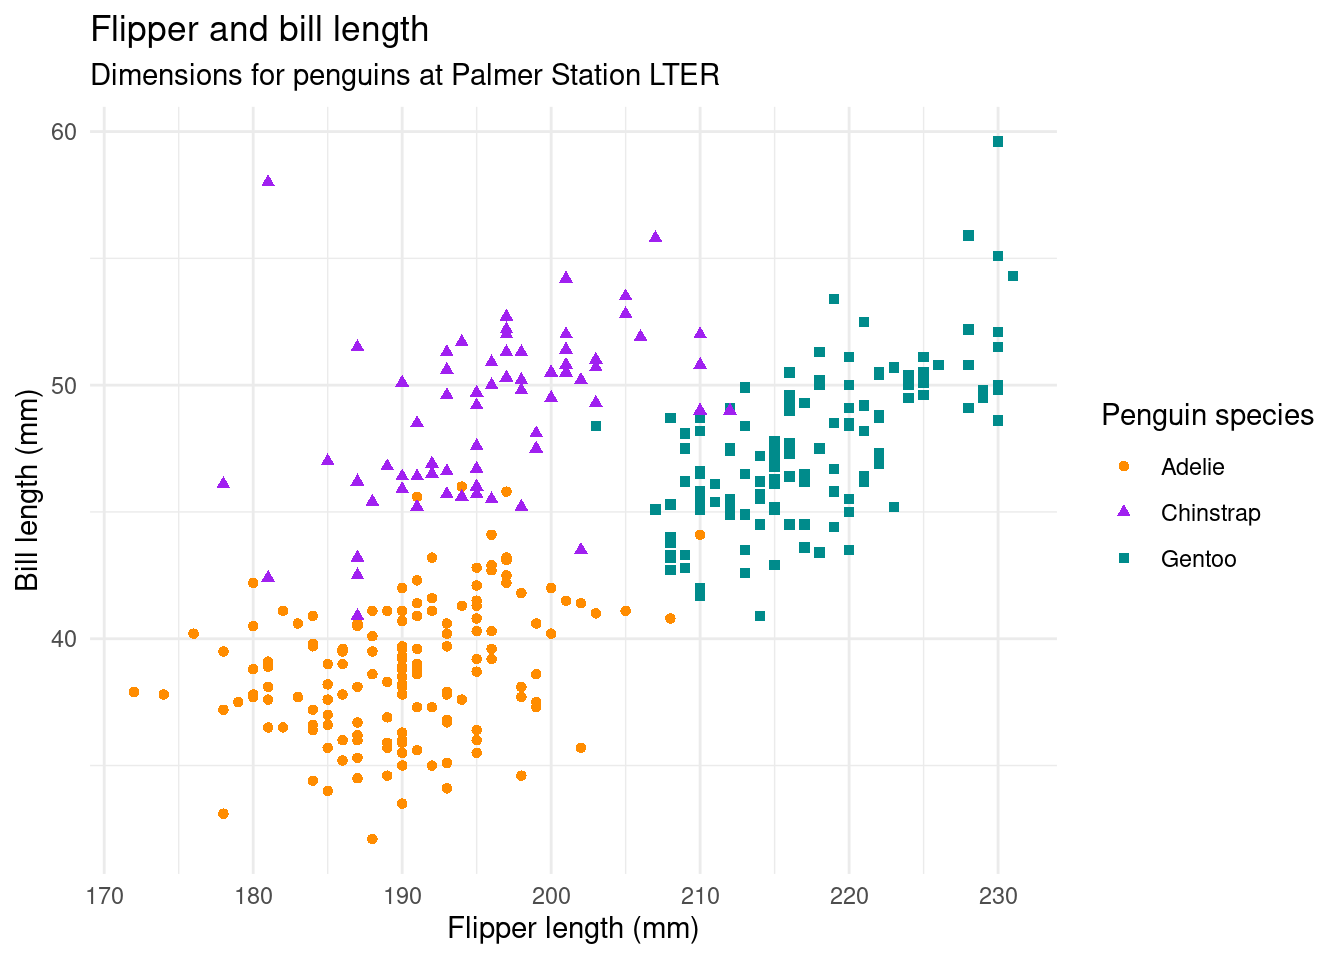
The penguins data from the palmerpenguins package contains size measurements for 344 penguins from three species observed on three islands in the Palmer Archipelago, Antarctica.
The plot below shows the relationship between flipper and bill lengths of these penguins.
ggplot(penguins, aes(x = flipper_length_mm, y = bill_length_mm)) +geom_point(aes(color = species, shape = species)) +scale_color_manual(values =c("darkorange","purple","cyan4")) +labs(title ="Flipper and bill length",subtitle ="Dimensions for penguins at Palmer Station LTER",x ="Flipper length (mm)", y ="Bill length (mm)",color ="Penguin species", shape ="Penguin species" ) +theme_minimal()